

Antibacterial Effect of Topically Administered Tranexamic Acid in Large Joint Arthroplasty


1
Valdoltra Orthopaedic Hospital, 6280 Ankaran, Slovenia
2
Faculty of Medicine, University of Ljubljana, 1000 Ljubljana, Slovenia
3
Faculty of Medicine, University of Maribor, 2000 Maribor, Slovenia
4
Faculty of Education, University of Primorska, 6310 Isola, Slovenia
*
Author to whom correspondence should be addressed.
Appl. Sci. 2023, 13(16), 9050; https://doi.org/10.3390/app13169050
Submission received: 24 May 2023
/
Revised: 2 August 2023
/
Accepted: 5 August 2023
/
Published: 8 August 2023
(This article belongs to the Special Issue Knee Arthroplasty: Current State of the Art in Clinical Application and Basic Research)
Abstract
:Tranexamic acid (TXA) is a synthetic derivative of the amino acid lysine and is commonly used as an antifibrinolytic agent in large joint surgery, such as knee arthroplasty, to minimize blood loss and its associated complications. Some studies have suggested that perioperative intravenous TXA application lowers the incidence of postoperative infections after hip and knee arthroplasty. While its effects on bacteria are not its primary purpose, more research is needed further to elucidate the extent of TXA’s impact on bacterial inhibition and its clinical relevance. In order to determine possible inhibitory effects, 22 clinically relevant bacterial strains were exposed to different TXA concentrations. Two different assays were performed: a microdilution assay with traditional endpoint measurements and a kinetic growth assay for a time-dependent susceptibility assessment. With the microdilution technique, a growth inhibitory effect became evident at higher TXA concentrations (50 and 100 mg/mL) on eight tested bacterial strains, of which four demonstrated absence of growth at 100 mg/mL, suggesting minimal inhibitory concentration. However, the kinetic growth assay revealed more specific TXA-induced dynamic changes in the bacterial growth of all tested bacterial strains. This study showed that TXA affects the growth dynamics of bacteria by altering their lag phase duration, exponential growth rate, and population density and may contribute to the prevention of implant-associated infections.
1. Introduction
Large joint reconstruction procedures such as hip or knee arthroplasty are characterized by relatively large blood loss, which often requires a postoperative allogenic blood transfusion. Increased perioperative blood loss poses an important risk factor for surgical site infection (SSI) and deep periprosthetic joint infection (PJI) in primary [1,2] and revision arthroplasty [3]. This correlation is most likely multifactorial and has to do with the patient’s immune response being affected by both the anemia and the increased requirements of perioperative transfusion [4,5]. The latter has been associated with higher morbidity and an increased risk of infection after arthroplasty, due to its significant immunomodulatory effects [6,7]. In an effort to reduce blood loss during surgery, a number of measures have been introduced in daily clinical practice. Along with meticulous hemostasis during surgical dissection, controlled hypotension, and regional anesthesia, antifibrinolytics are increasingly being used to reduce perioperative blood loss in both elective and emergency settings. Among them, tranexamic acid (TXA) has proved to be the safest and most effective [8,9,10,11,12].
TXA’s effectiveness in reducing blood loss and the need for blood transfusion after surgery, as well as good penetration into large joints, has been confirmed by extensive meta-analyses [9,13]. The use of perioperative TXA in large joint arthroplasty has since become established and is most commonly administered intravenously as a single dose of 1 g or 15 mg/kg, around 5 min before the skin incision. With increased utilization of TXA, due to its beneficial antifibrinolytic properties, the association with a lower incidence of postoperative infection rates has also become apparent [14,15]. This can partially be explained by the decrease in the number of required blood transfusions and its immunomodulatory properties, together with other direct and indirect TXA effects that might contribute to increased postoperative immunity and wound-healing capacity [16,17,18,19,20].
In order to avoid any potential systemic side effects when used intravenously, topical application of TXA has increasingly been established in orthopedic clinical practice. It has been shown to be comparatively effective in reducing blood loss and transfusion requirements, with up to 70% lower serum concentrations in comparison with intravenous usage [21]. Other advantages of topical use of TXA include direct and faster effect at the bleeding site, ease of application, and reduction of joint swelling, all of which improve healing and allow for faster rehabilitation after large joint arthroplasty [22,23,24]. Additionally, intraarticular infiltration of TXA has proved beneficial in reducing the number of hematomas and other common complications of surgical wounds [22]. Several in vitro studies have demonstrated the cytotoxic effect of TXA on human cells and tissues, with concentrations of 50–100 mg/mL having a significant detrimental effect on most of the studied cells after only a few hours of exposure, while even lower TXA concentrations were sufficient for a similar cytotoxic effect in chronic exposure [23,24,25,26]. Considering the expected local concentrations of 5–100 mg/mL after standard topical application of 1–3 g TXA, a possible cytotoxic effect on bacterial cells is in question. Some recent studies have examined the potential effect of TXA on bacteria and biofilm formation, mostly using Staphylococcus aureus and Staphylococcus epidermidis species, except for one study in which they also analyzed effects on Cutibacterium acnes [27,28,29].
In this study, we aimed to investigate the potential antibacterial effect of TXA on the most common pathogenic bacteria associated with PJI and its likely contribution to a reduction of early postoperative infection rates. To the best of our knowledge, our study is the most extensive investigation of TXA effects on bacterial growth, assessing 22 bacterial strains belonging to 7 different species: S. aureus, S. epidermidis, S. lugdunensis, P. aeruginosa, E. faecalis, E. faecium, and E. coli.
2. Materials and Methods
2.1. Bacteria
Bacterial strains used in the study and strain details are presented in Table 1. ATCC strains were purchased from the American Type Culture Collection (ATCC, Manassas, VA, USA; Vancouver, BC, Canada) and DSM strains were purchased from the German Collection of Microorganisms and Cell Cultures GmbH (DSMZ, Deutsche Sammlung von Mikroorganismen und Zellkulturen GmbH). OBV clinical isolates were obtained from the “in-house” isolates library of Valdoltra Orthopaedic Hospital and were cultivated during routine microbiological diagnostic procedures from sonicate fluid samples of patients undergoing revision surgery due to PJI. Species were determined by conventional microbiological culturing methods and confirmed by sequencing.
2.2. Microdilution Technique for the Determination of MIC and MBC of Tranexamic Acid
For bacterial strains listed in Table 1, minimal inhibitory concentrations (MIC) of TXA were determined by the microdilution technique [30] in 96-well microtiter plates (sterile, F-Bottom, µClear, Black) from Greiner bio-one (Frickenhausen, Germany). Tranexamic acid powder was purchased from Sigma-Aldrich (St. Louis, MO, USA) and dissolved in brain heart infusion (BHI) broth to obtain a stock concentration of 133.3 mg/mL. Final tested TXA concentrations to determine MICs ranged from 100 mg/mL to 0.1 mg/mL. Two-times dilutions of TXA were prepared in BHI broth. Bacterial suspensions were prepared by suspending 5 individual colonies from fresh overnight BHI agar plates in 5 mL BHI and incubated at 37 °C with shaking for 24 h. The culture was then adjusted to match the turbidity of a McFarland 0.5 Standard (1–2 × 10⁸ cfu/mL) and further diluted to obtain a final bacterial concentration of 5 × 10⁵ cfu/mL in each well. Positive growth controls (bacterial suspensions without TXA) were assessed along with each tested strain. BHI alone and BHI with all tested TXA concentrations (without bacteria) were also assessed as negative growth controls. Microtiter plates were incubated at 37 °C for 24 h. To determine the proliferation of bacterial cells at different TXA concentrations, PrestoBlue™ Cell Viability Reagent (Invitrogen Life Technologies, Carlsbad, CA, USA) was added to wells according to the manufacturer’s instructions. Plates were then incubated in the dark for 2 h at 37 °C. The assay was performed in triplicate for each strain. Fluorescence was measured with a Tecan Infinite 200 Pro MPlex plate reader (Tecan, Männedorf, Switzerland) with excitation and emission wavelengths set at 560 nm and 590 nm, respectively. Fluorescence values (mean values from three replications ± standard deviation) were plotted vs. TXA concentration. MIC values were determined as the lowest TXA concentrations that prevented the visible growth of bacteria. To determine the possible bactericidal activity of TXA (minimal bactericidal concentration (MBC)), 100 µL of bacterial culture from the microtiter plate wells, in which no visible growth was observed, were spread over BHI agar plates and incubated at 37 °C for 24 h.
2.3. Kinetic Growth Assay
Kinetic growth assays were performed to determine the effect of TXA on bacterial growth. Two-times dilutions of TXA in BHI broth were prepared in clear 96-well microtiter plates (sterile, F-Bottom) from Greiner Bio-One (Frickenhausen, Germany). To minimize evaporation from wells during incubation, the outer wells of the plates were filled with 200 µL of distilled water. Plate covers were pretreated with 0.05% Triton X-100 (Sigma-Aldrich, St. Louis, MO, USA) in 20% ethanol to make them hydrophilic and avoid condense formation during incubation [31]. Briefly, 6 mL of the solution was pipetted onto the cover and allowed to coat the surface for 30 s. The solution was then pipetted off and the cover was left to air-dry.
Bacterial suspensions were prepared as described earlier for MIC determination so that the final bacterial concentrations in the assay were 5 × 10⁵ cfu/mL. Final tested TXA concentrations in the kinetic growth assay ranged from 100 mg/mL to 0.78 mg/mL. Bacterial suspensions without TXA were assessed along with each tested strain as positive growth (reference) controls. BHI alone and BHI with all tested TXA concentrations (without bacteria) were also assessed for background subtraction as negative growth controls (blanks).
The 96-well microtiter plate was incubated in a Tecan Infinite 200 Pro MPlex plate reader at 37 °C for growth and monitoring of turbidity. Applied assay conditions were as follows: wavelength, 600 nm; mode, kinetic cycle; kinetic cycle duration, 24 h; read interval, 15 min; shaking, orbital; shaking speed, 244 rpm; shaking duration, 120 s; temperature, 37 °C. Plate shaking was set to occur twice per cycle, at the beginning and end of the 15 min incubation interval, to prevent sedimentation of bacteria. Obtained measurements were used to generate growth curves of bacteria at different TXA concentrations by plotting OD 600 nm against time. The maximum specific growth rate (μ) and the lag phase duration (λ) were obtained by applying the Gompertz model [32]:
y = a × exp (−exp(−(x − x0)/b)).
The equation was fitted to bacterial growth curves using SigmaPlot 12.0 (Systat Software, Chicago, IL, USA) and all model parameter estimates (a, b, and x0) were so obtained. The maximum specific growth rate was then calculated as:
and the lag phase duration as:
µ = a/(b × e),
λ = x0 − b.
2.4. Statistics
The collected data for MIC determination were presented in the form of line and scatter charts with standard deviations and were statistically analyzed by analysis of variance (ANOVA) in SigmaPlot 12.0 following the model ONE-WAY ANOVA and Dunnett’s test (α = 0.05) by comparing treatment groups to a single control group (positive and negative growth controls). Statistical significance was defined as p < 0.01. MICs were determined as the lowest TXA concentrations, at which the measured fluorescence signal of a bacterial culture did not statistically differ from the fluorescence measured in negative growth control wells (p ≥ 0.01). The data collected during the kinetic growth assay were presented in the form of a multiple spline curves plot using SigmaPlot 12.0. The curves represented the mean of measured turbidity values (OD600nm) as a function of time. SDs were all less than 5%.
3. Results
3.1. Determination of the Antiproliferative Effect of Different TXA Concentrations with the Microdilution Technique
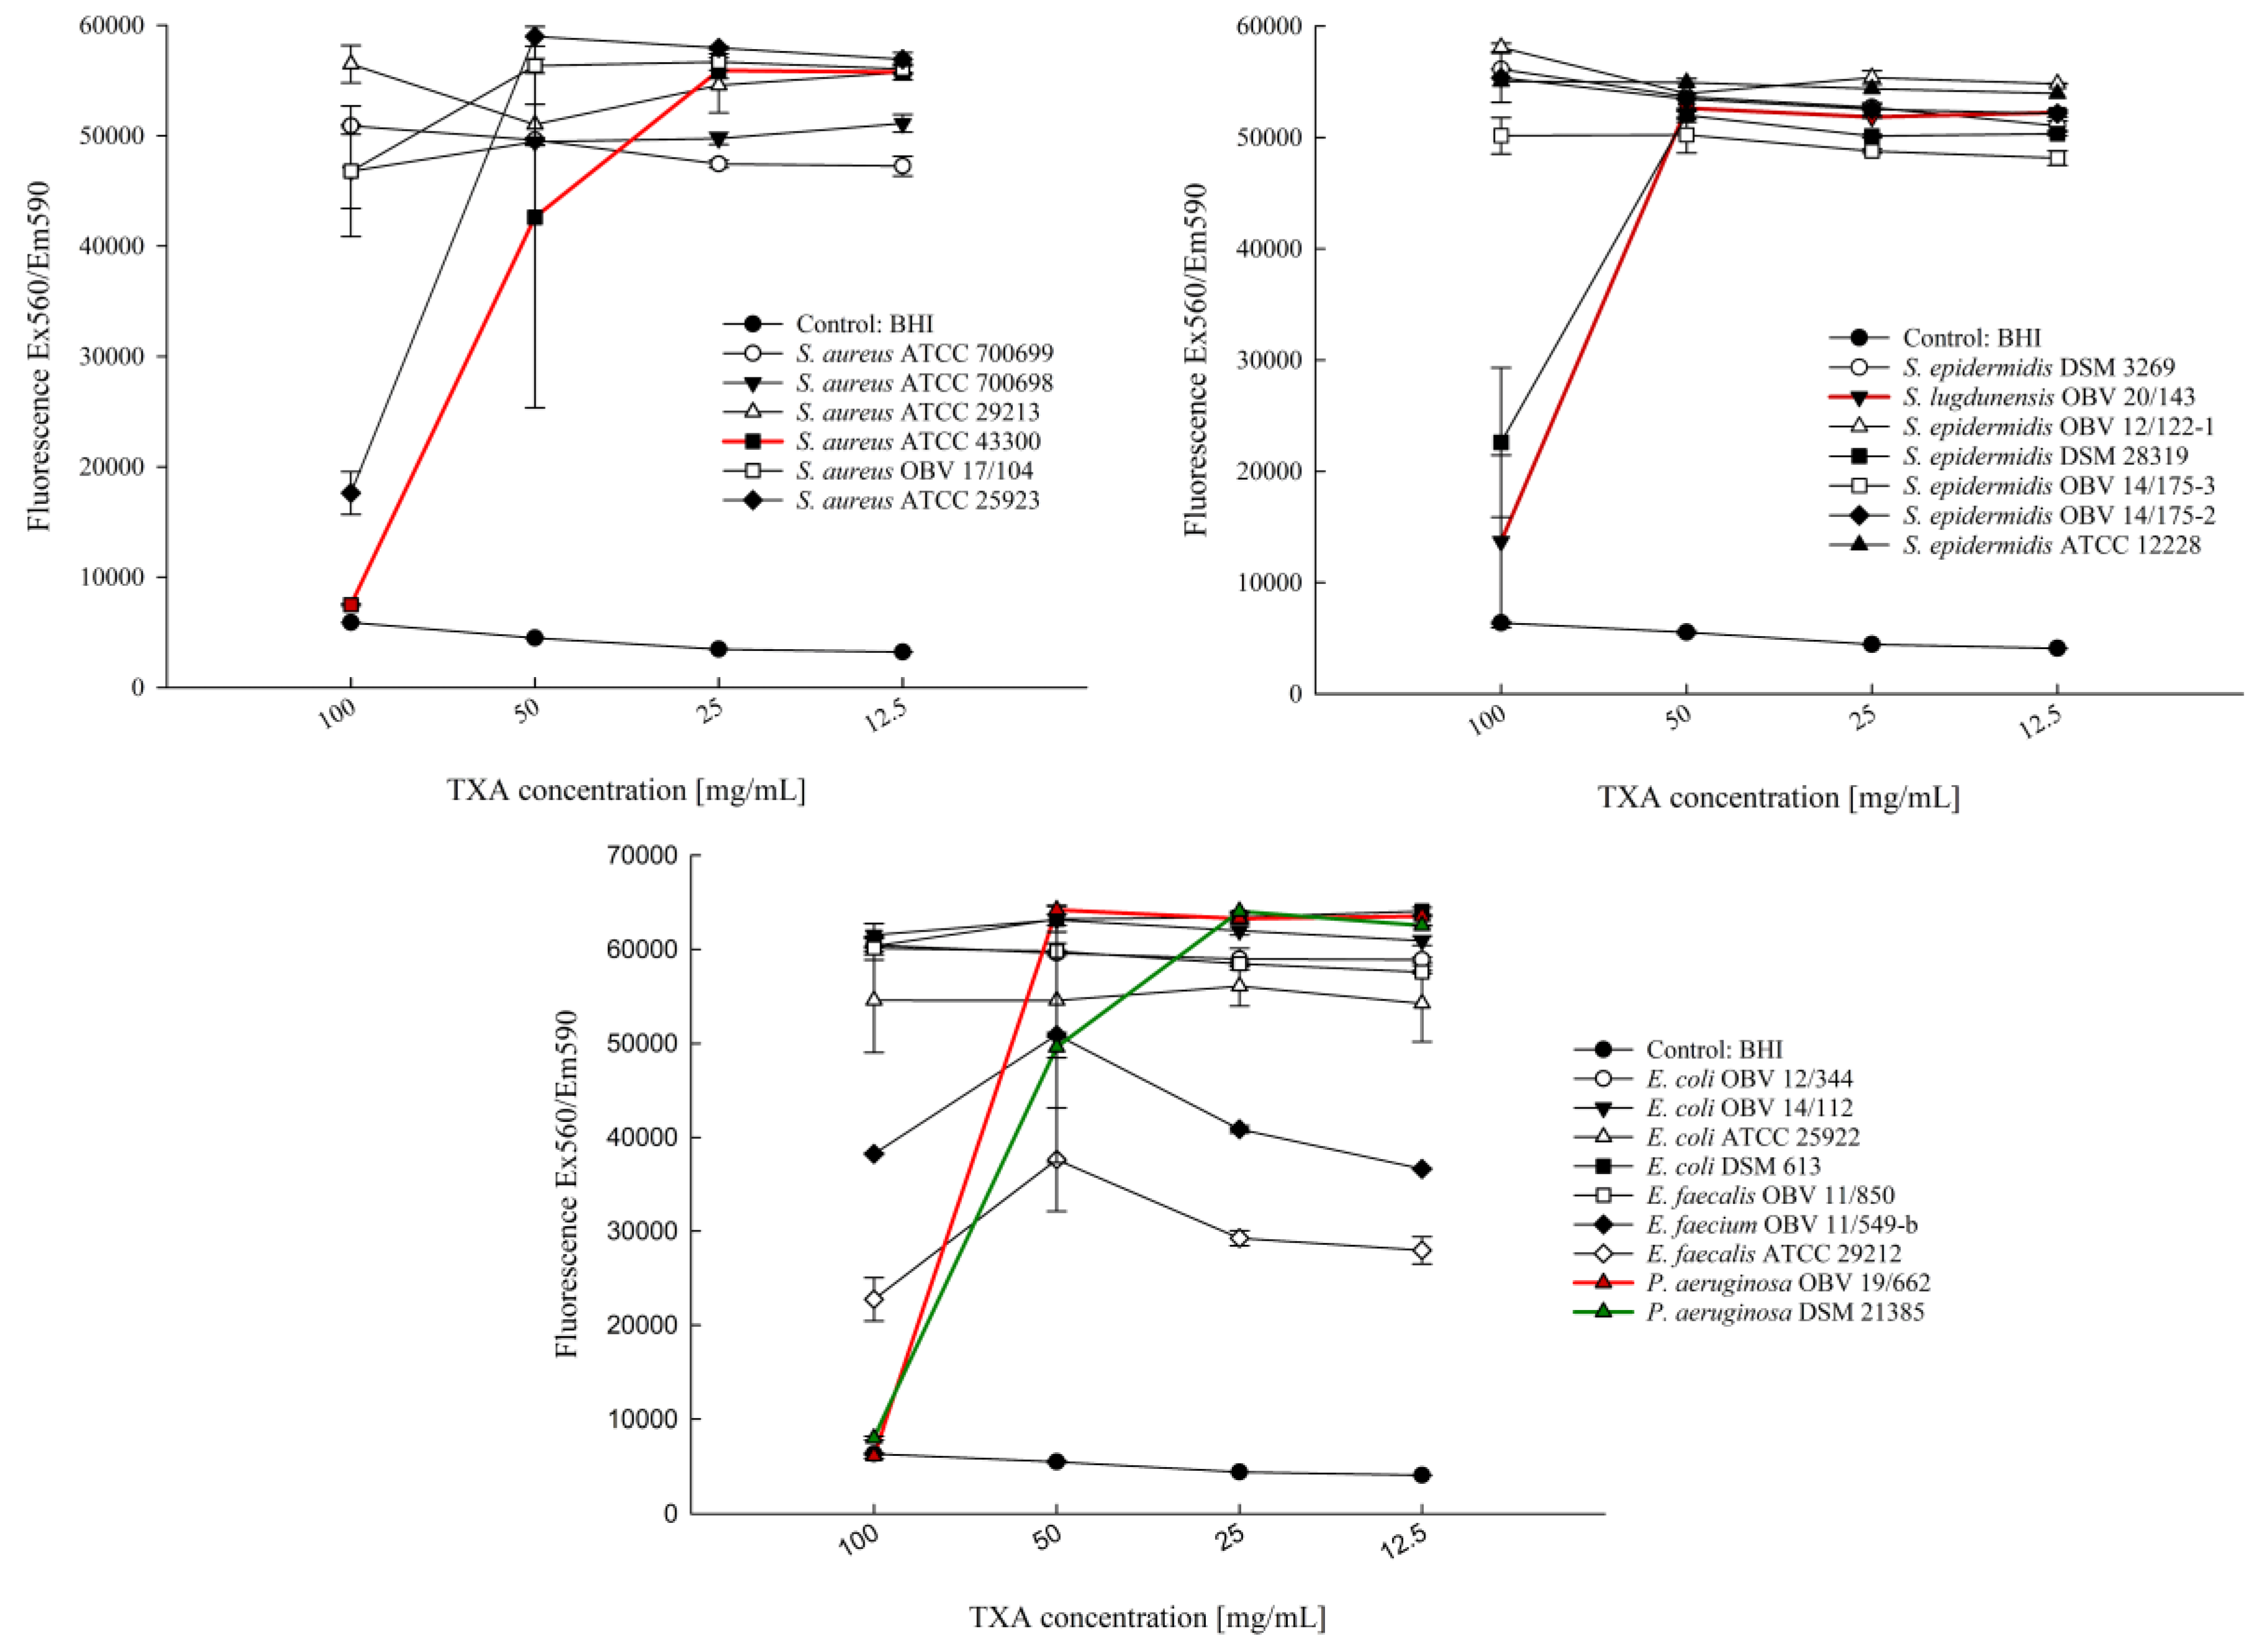
Twenty-two clinically relevant bacterial strains were exposed to different TXA concentrations for 24 h to determine possible inhibitory effects of the drug. Results of the microdilution assay are presented in Figure 1 and show no effect of tested TXA concentrations on the growth of 14 tested bacterial strains.
At a concentration of 100 mg/mL, a statistically significant reduction in bacterial growth was observed for S. aureus ATCC 25923 (p < 0.001), S. epidermidis DSM 28319 (p < 0.001), P. aeruginosa OBV 19/662 (p < 0.001), P. aeruginosa DSM 21385 (p < 0.001), S. aureus ATCC 43300 (p < 0.001), S. lugdunensis OBV 20/143 (p < 0.001), E. faecalis ATCC 29212 (p < 0.001), and E. faecium OBV 11/549-b (p < 0.001) compared with their respective positive growth controls. For P. aeruginosa DSM 21385 (p < 0.001), a reduction in bacterial growth was also observed at a concentration of 50 mg/mL.
In P. aeruginosa OBV 19/662 (p = 1.000), P. aeruginosa DSM 21385 (p = 0.628), S. aureus ATCC 43300 (p = 0.810), and S. lugdunensis OBV 20/143 (p = 0.011) no growth with no statistically significant difference compared with the negative growth control was observed at 100 mg/mL TXA, which was determined as their MIC. However, none of the tested TXA concentrations had a bactericidal effect on any of the 22 tested bacterial strains.
3.2. Kinetic Growth Assay
To assess potential initial inhibitory or bactericidal effects of TXA’s sub-MICs, that may not be maintained during the total 24 h incubation time, a kinetic growth assay was performed analyzing the growth time-dependent susceptibility of 22 clinically relevant bacterial strains.
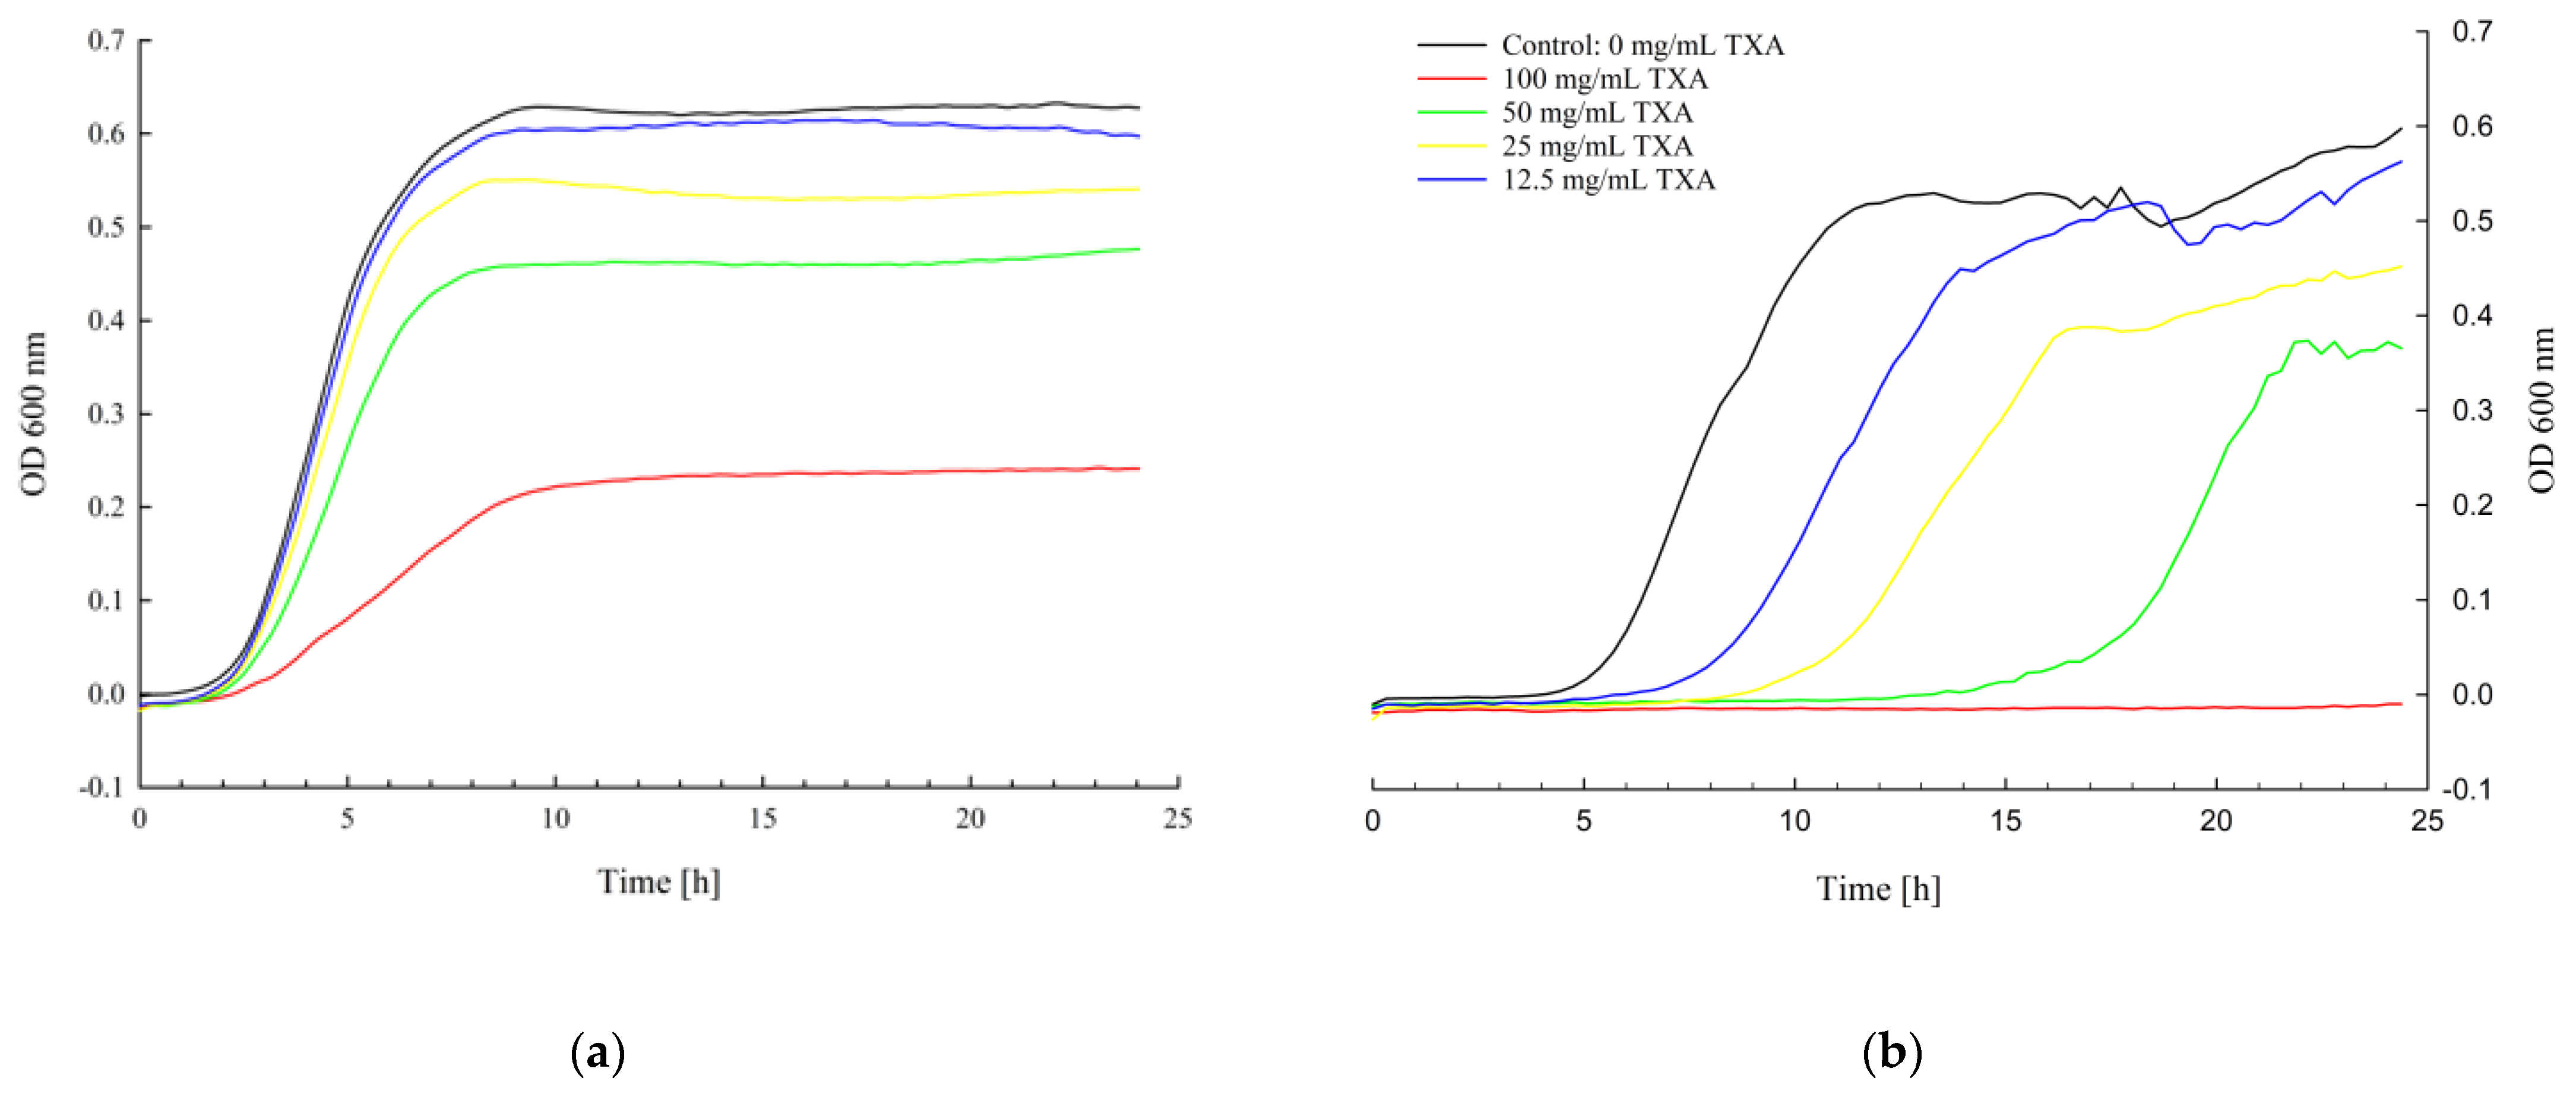
Growth analysis showed various susceptibilities of the tested bacterial strains to different TXA concentrations at different growth stages. Microbial growth patterns for E. faecalis OBV 11/850 and S. aureus ATCC 43300 presented in Figure 2 are examples of different TXA-specific dynamic growth profiles. Growth curves for the other 20 tested bacterial strains are presented in Figures S1–S20 in the Supplementary Material.
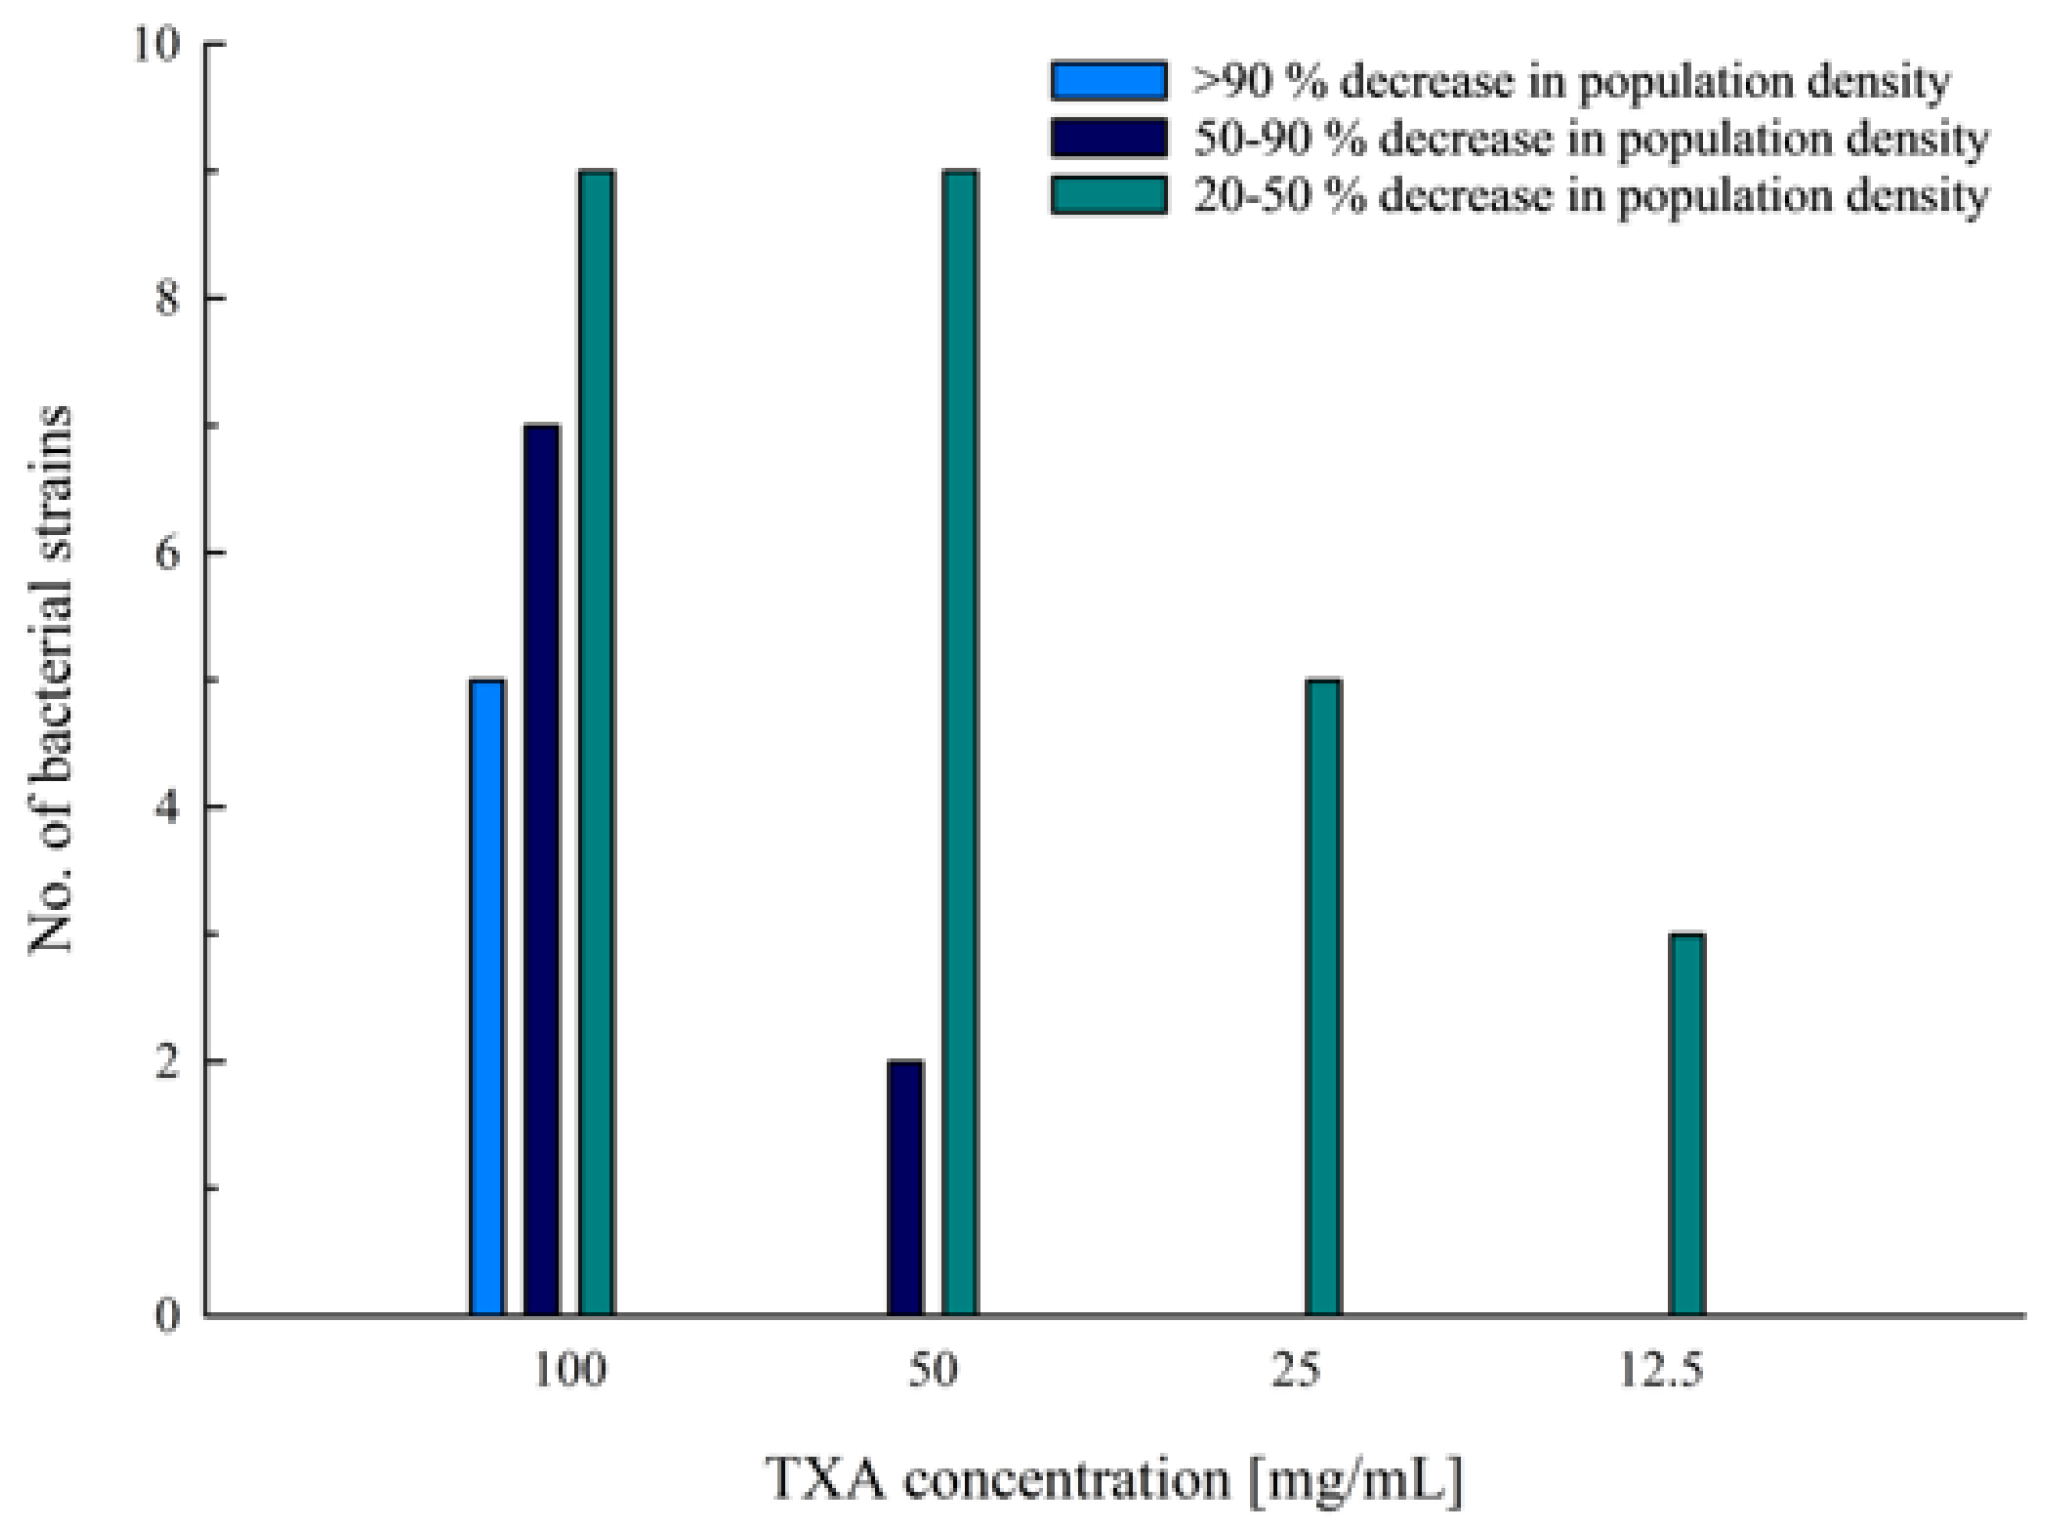
At a concentration of 100 mg/mL, no growth was observed for strains S. aureus ATCC 43300 (Figure 2b), S. epidermidis ATCC 28319 (Figure S6), P. aeruginosa DSM 21385 (Figure S13), and P. aeruginosa OBV 19/662 (Figure S14). For S. lugdunensis OBV 20/143, the culture’s OD started to increase slightly after 21.5 h of incubation with 100 mg/mL of TXA. However, the culture still showed a 94% reduction in population density compared with its reference control after 24 h of incubation (Figure S12). At a concentration of 100 mg/mL, a substantial reduction in bacterial growth was observed in cultures of S. aureus OBV 17/104, S. epidermidis DSM 3269, S. epidermidis ATCC 12228, S. epidermidis OBV 14/175-3, E. faecalis ATCC 29212, E. faecalis OBV 11/850 (Figure 2a), and E. faecium OBV 11/549-b. For E. faecium OBV 11/549-b and S. epidermidis DSM 28319, the same was also observed at a concentration of 50 mg/mL. For the mentioned strains, a 50–90% decrease in population density was observed after 24 h of incubation compared with their reference controls (Figure 3).
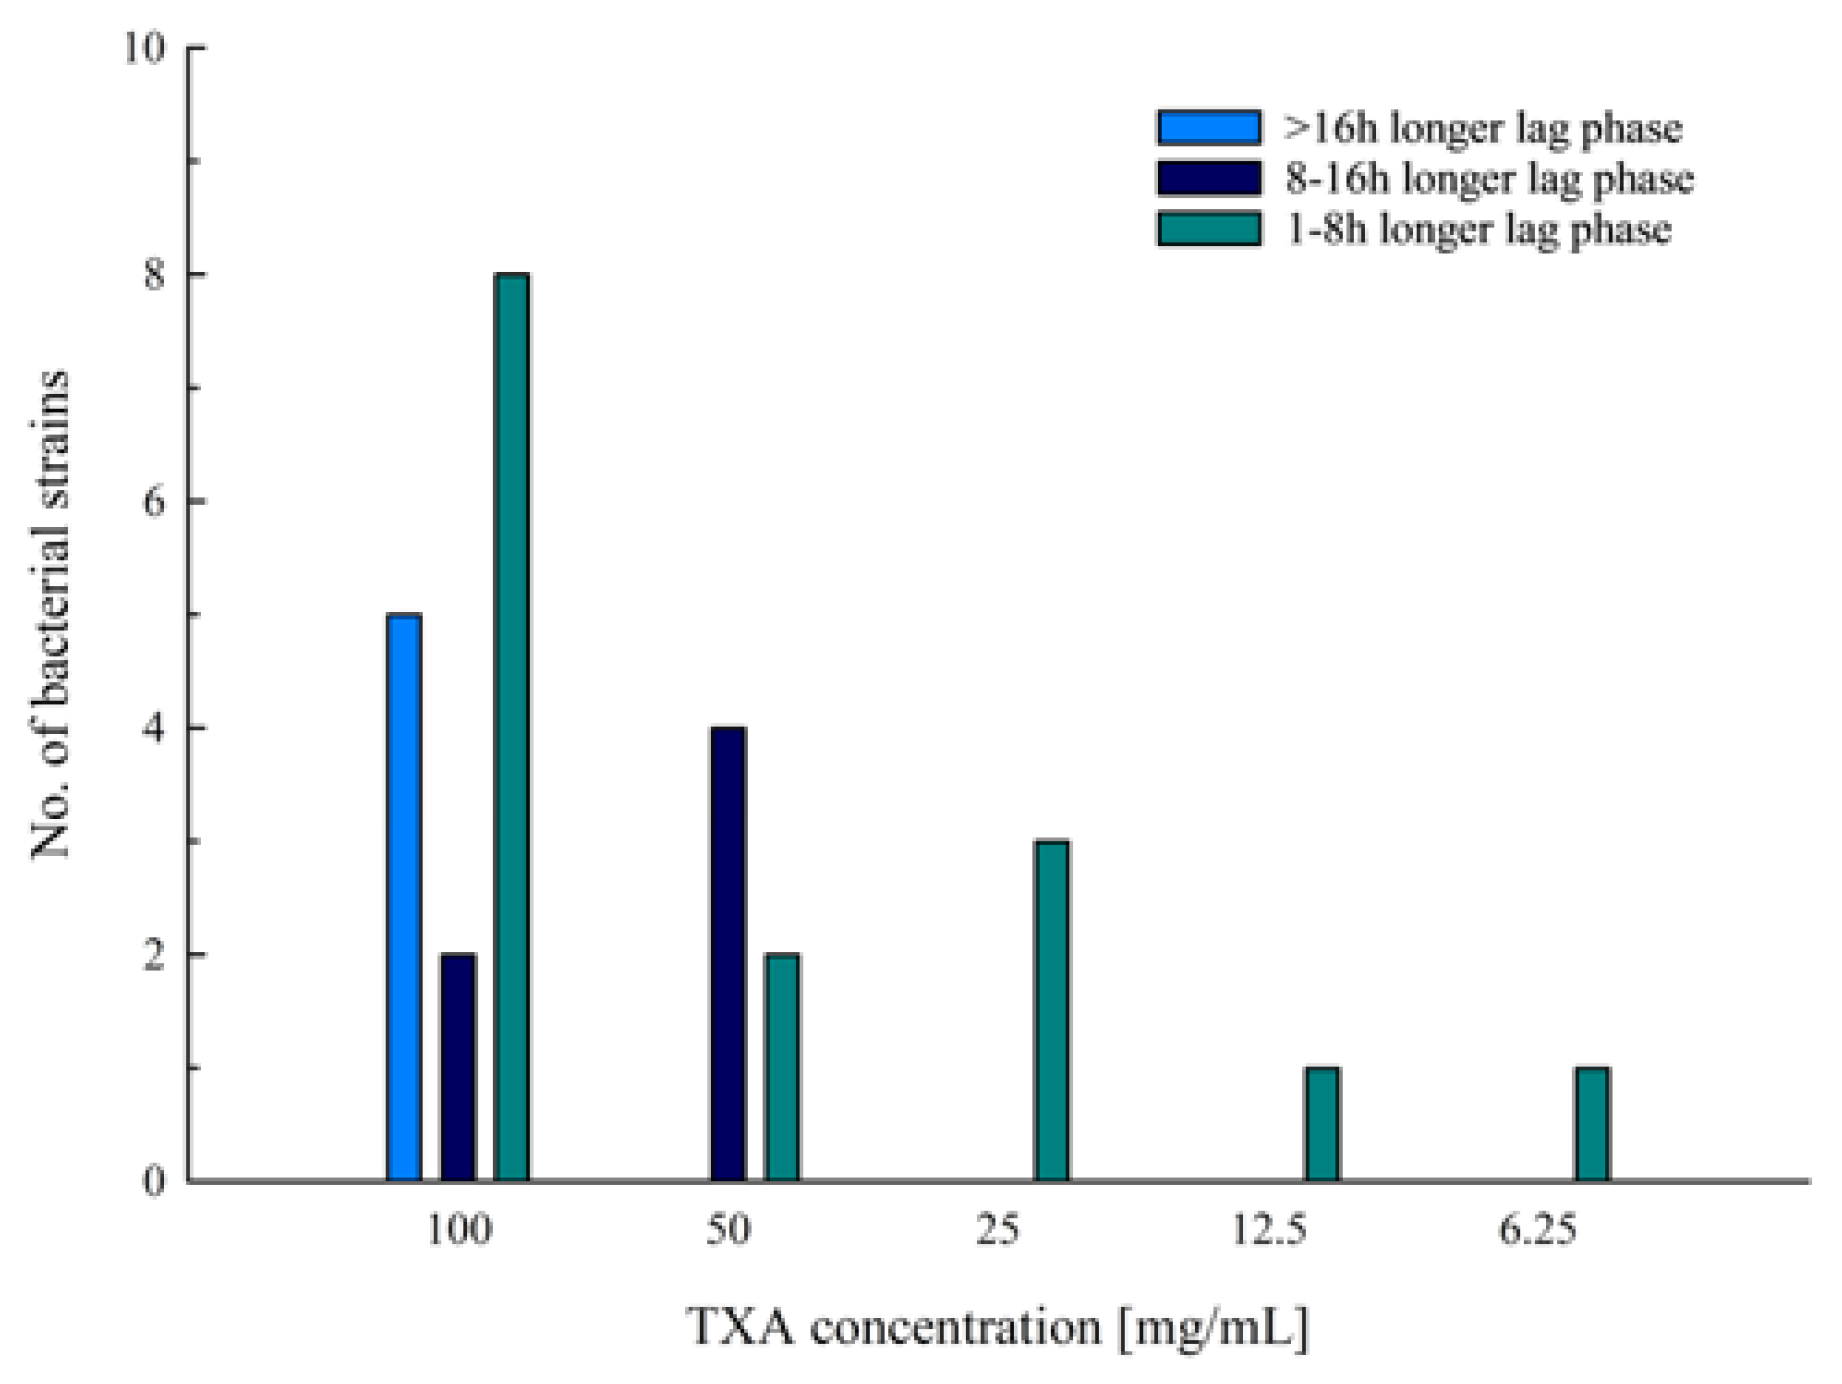
To describe and compare the growth of bacteria, two key growth parameters—the lag time (λ) and specific growth rate (µ)—were obtained by curve-fitting procedures. Parameters for all bacterial cultures at different tested TXA concentrations are reported in Table S1. Extended lag phases (>1 h longer than the reference controls) were observed in 14 out of 22 tested bacterial strains at TXA concentrations equal to or higher than 6.25 mg/mL (Figure 4). However, longer lag phases that extended 8 to 16 h over the reference control’s lag phases were observed only in cultures for which TXA concentrations of 50 mg/mL (S. aureus ATCC 43300, S. aureus ATCC 25923, S. epidermidis DSM 28319, and S. lugdunensis OBV 20/143) and 100 mg/mL (S. aureus OBV 17/104 and S. aureus ATCC 25923) were applied. Cultures with a lag phase that exceeded the 16 h difference compared with their reference control did not grow during the 24 h incubation period, except for S. lugdunensis OBV 20/143, which started to show some growth after 21.5 h of incubation, as already mentioned.
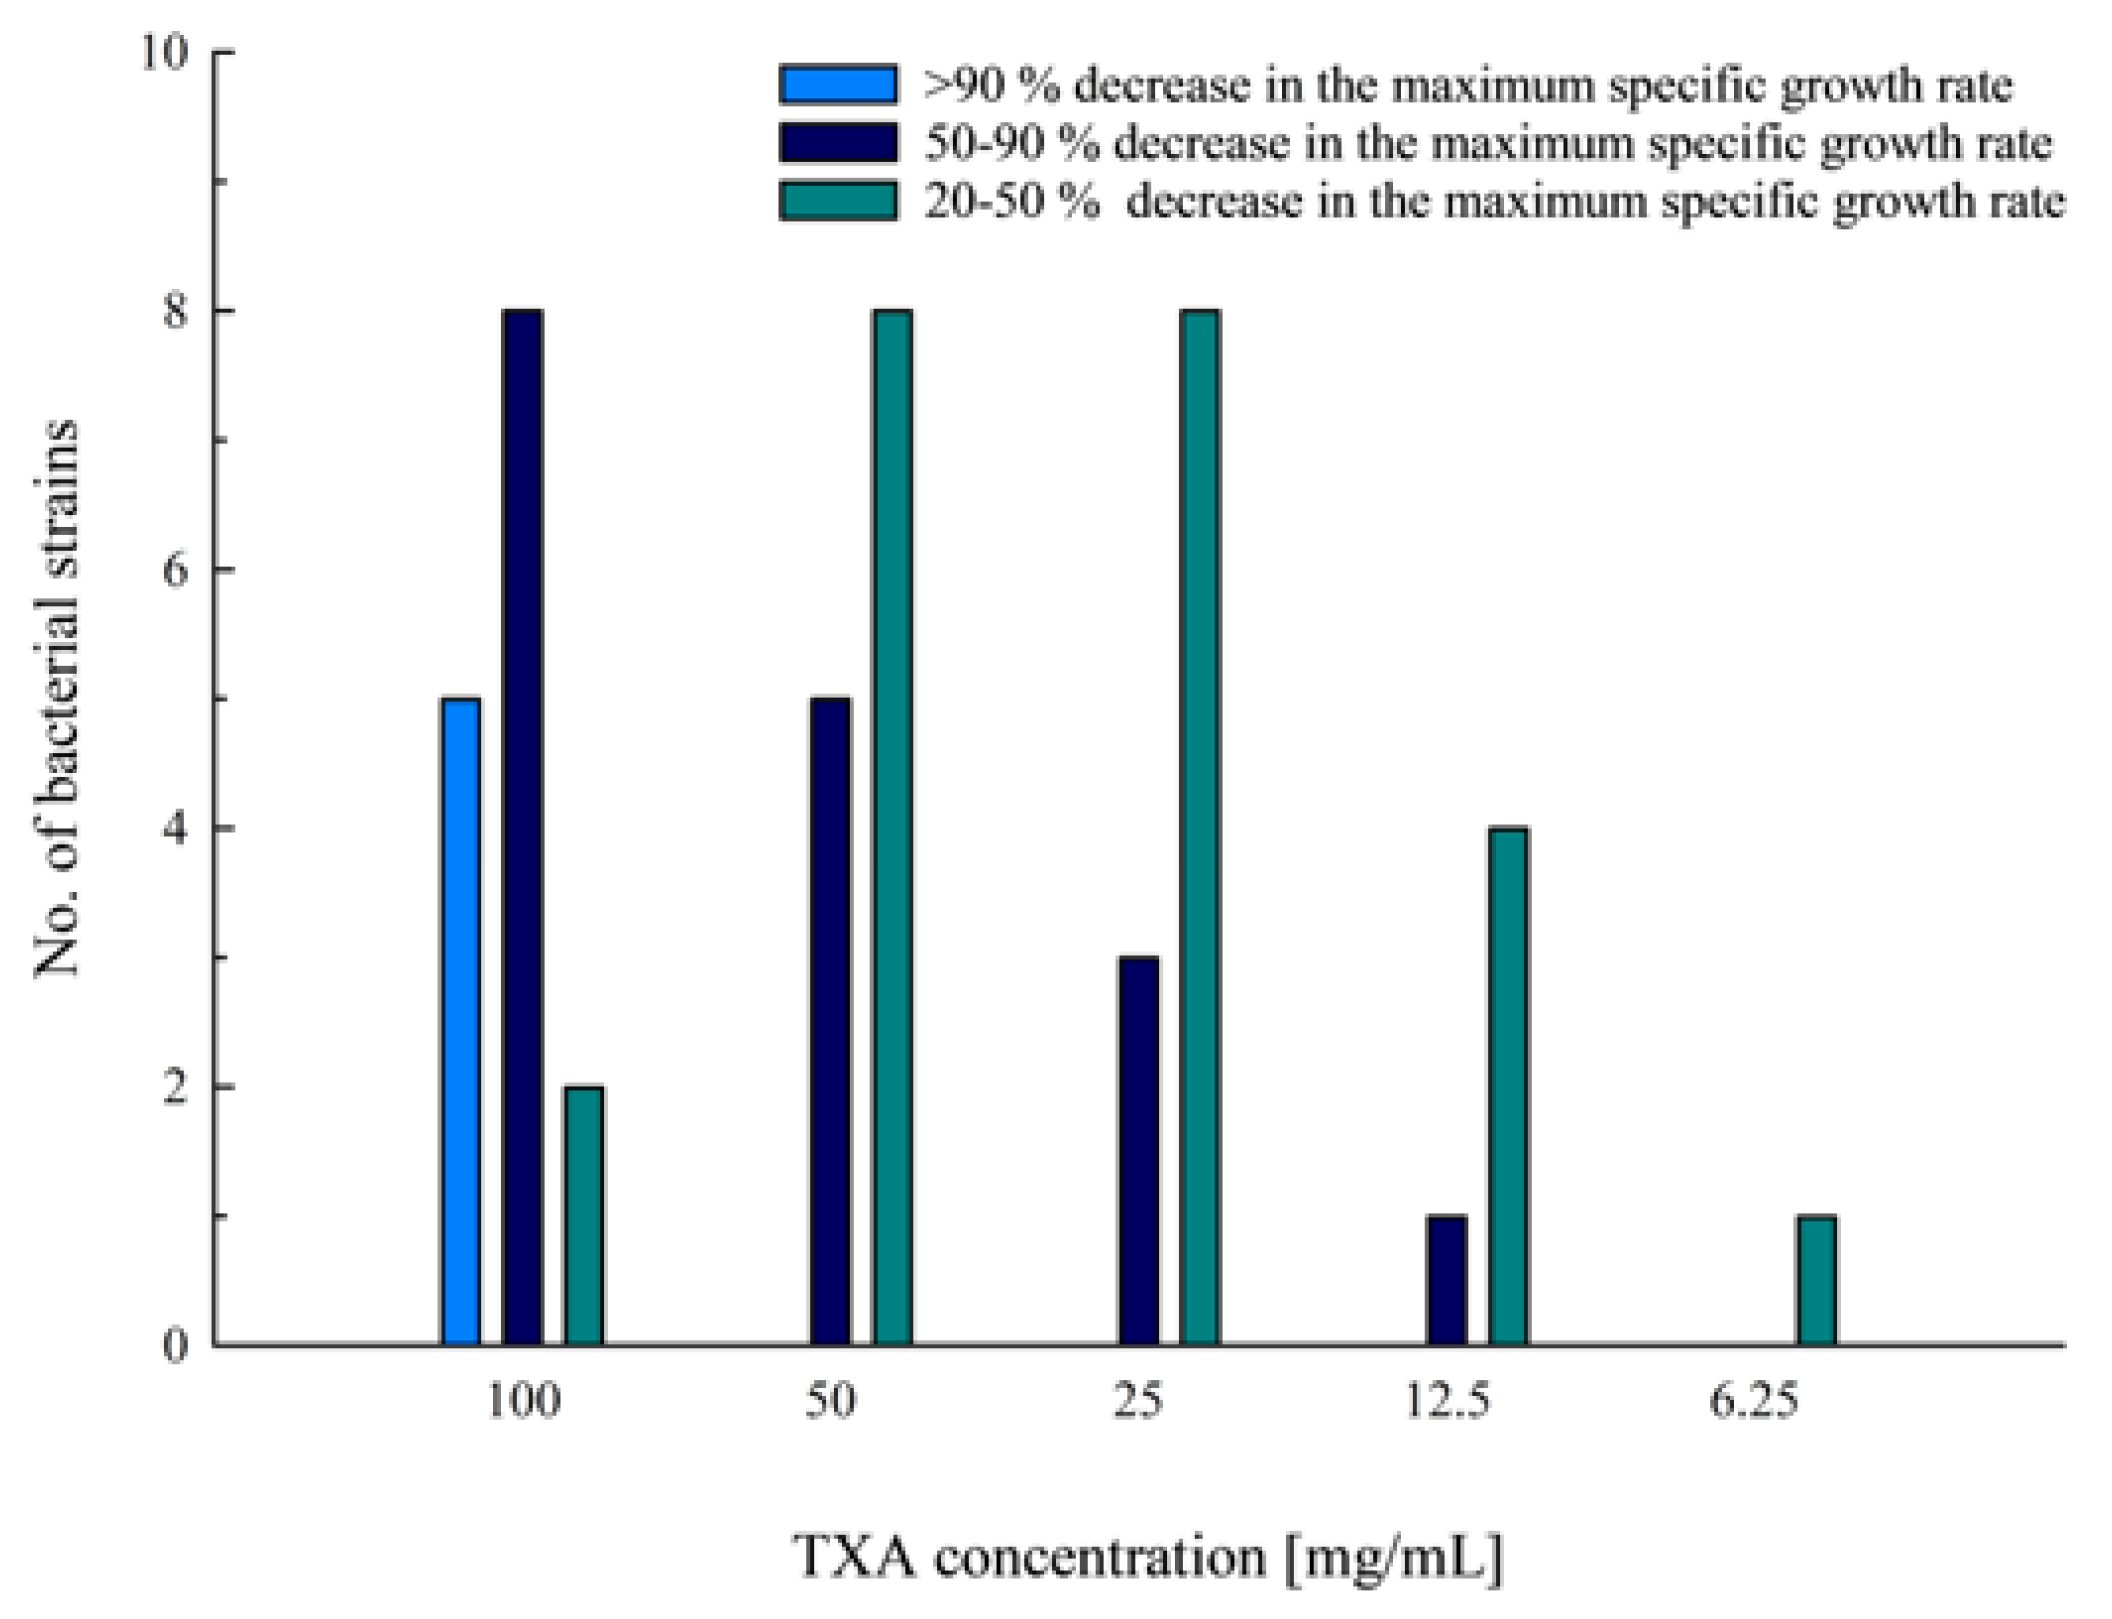
TXA concentrations equal to or higher than 6.25 mg/mL showed some effect on the maximum specific growth rate of the tested bacterial cultures, decreasing it by more than 20% (Figure 5). Cultures with a more than 90% decrease in the maximum specific growth rate compared with their reference control were S. epidermidis ATCC 12228 and cultures that did not grow during the 24 h incubation period at a TXA concentration of 100 mg/mL. At the same concentration, eight additional bacterial strains (S. aureus ATCC 25923 and OBV 17/104, S. epidermidis 14/175-3 and DSM 3269, S. lugdunensis OBV 20/143, E. faecalis OBV 11/850, E. faecium OBV 11/549-b, and E. coli OBV 12/344) showed a decrease in the maximum specific growth rate of between 50 and 90% compared with their reference control. The same percentage decrease was seen at a concentration of 50 mg/mL for five bacterial strains (S. epidermidis DSM 28319, DSM 3269 and ATCC 12228, S. aureus OBV 17/104, and P. aeruginosa DSM 21385), at 25 mg/mL for three bacterial strains (S. aureus ATCC 25923, S. lugdunensis OBV 20/143, and S. epidermidis DSM 28319), and at 12.5 mg/mL for S. aureus ATCC 25923, which exhibited a substantial 33% decrease in maximum specific growth rate even at a TXA concentration of 6.25 mg/mL. In all tested bacterial cultures, a 20 to 50% decrease in the maximum specific growth rate was observed in at least one of the concentrations ranging between 6.25 and 100 mg/mL.
4. Discussion
With the objective of better understanding the local effects of topically administered TXA and its potential contribution to a reduction of early postoperative infections in arthroplasty, we designed an in vitro study aimed at evaluating its effect on clinically relevant bacterial strains. Presumed growth inhibitory and bactericidal effects of TXA were investigated using a microdilution technique and kinetic growth assay. None of the tested TXA concentrations had a bactericidal effect on any of the 22 tested bacterial strains, since bacteria reassumed growth after subculturing onto media without TXA. However, a growth inhibitory effect was shown on eight tested bacterial strains at higher TXA concentrations (50 and 100 mg/mL) with the microdilution technique. More specific TXA-induced dynamic changes in bacterial growth of all tested bacterial strains became evident during the kinetic growth assay.
TXA is an antifibrinolytic drug used routinely in orthopedic surgery. It inhibits fibrinolysis by blocking the lysine binding site on plasminogen, competitively inhibiting the activation of plasminogen to plasmin [9]. Some studies have found that application of TXA can also decrease the incidence of periprosthetic joint infections. Based on the available literature, some of the beneficial effects in regard to postoperative infection rates can be attributed to the antifibrinolytic effect of TXA, since it has been shown significantly to lower the incidence of surgical wound hematomas [22], which in themselves predispose a wound to bacterial colonization. Additionally, it reduces the overall need for allogenic blood transfusions, which carry immunomodulatory properties and have been shown to increase the risk of infection after arthroplasty [6,7,33,34]. While TXA is commonly used in surgical settings, particularly in orthopedic surgeries, only a few studies investigating its effects on bacteria and biofilm have been performed, showing mixed results.
A recent study conducted in vitro by Benjumea et al. [27] assessed the effect of TXA on bacterial growth of 6 S. aureus, 4 S. epidermidis, and 4 C. acnes strains. They concluded that the percentage of reduction in bacterial growth was greater at lower TXA concentrations. However, this study only tested its effect at concentrations of 10 and 50 mg/mL, using endpoint measurements of bacterial counts, cell viability, and metabolic activity. In another study by Benjumea et al. [28], they researched the possible synergistic effect of TXA combined with vancomycin or gentamicin. They reported a synergistic effect of TXA with antibiotics against staphylococcal strains, which was more pronounced at 10 mg/mL compared with 50 mg/mL of TXA. Our findings did not correlate with those shown in their studies. However, we performed kinetic growth assays that allowed for continuous monitoring of bacterial growth over time and growth curve examinations. Our results showed a dose-dependent growth inhibition observed at TXA concentrations equal to or higher than 6.25 mg/mL, with a better inhibitory effect at higher concentrations. Similar findings were also reported by Wang et al. [29] during their studies on biofilm inhibition. They discovered that TXA inhibited biofilm formation at concentrations equal to or higher than 10 mg/mL in a dose-dependent manner. Moreover, they suggested that inhibition was due to the suppression of proteins and polysaccharide components. TXA at concentrations of 25 mg/mL and 50 mg/mL was also successful in biofilm prevention in an in vivo mouse implant-associated model. However, this study was performed only on two S. aureus strains.
To the best of our knowledge, our study is the most extensive study to date of TXA effects on bacterial growth, assessing 22 bacterial strains obtained from commercially available cell culture collections and the clinical isolates library of our hospital, which belong to 7 different species (6 S. aureus strains, 6 S. epidermidis strains, one S. lugdunensis strain, 2 P. aeruginosa strains, 2 E. faecalis strains, one E. faecium strain, and 4 E. coli strains) and are some of the most common bacterial pathogens responsible for early PJIs [35].
In our study, we compared the results obtained from two different assays: the broth microdilution assay, which is one of the current reference methods for the conventional testing of antimicrobial susceptibility [36], and the kinetic growth assay, by which real-time growth analysis is possible [37]. The first method consisted of endpoint measurements after 24 h of incubation and gave limited results on the TXA’s inhibitory action, with only high TXA concentrations (50 and 100 mg/mL) showing growth inhibition on a limited number of bacterial strains. With endpoint growth determination, however, the potential effects of lower TXA concentrations did not become visible. We therefore decided to perform supplementary kinetic growth assays with growth curve analysis, which allowed us to track potential changes in bacterial growth rates in relation to different TXA concentrations. The method enabled the assessment of important growth parameters and TXA’s antimicrobial activity through time, which was not addressed in previous studies [27,28,29]. Our findings showed that TXA concentrations below 6.25 mg/mL did not affect bacterial growth in any way. At a concentration of 6.25 mg/mL, we observed a decrease in the maximum specific growth rate and an extension of the lag phase only in one S. aureus strain. However, TXA concentrations ranging from 12.5 mg/mL to 50 mg/mL also resulted in partial growth inhibition for other tested bacteria, marked by a decrease in population densities after 24 h of incubation, extended lag phases, and decreased maximum specific growth rates. Only at the highest tested concentrations of 100 mg/mL did TXA completely inhibit the growth of five bacterial strains from four different bacterial species. At TXA concentrations of 12.5 mg/mL or higher, in addition to the observed extended lag phases, bacterial final turbidity values (after 24 h) did not reach those of their respective positive controls. Lower population densities in the plateau phase suggested a bactericidal effect of TXA on some bacterial cells within the population, with the subsequent regrowth of surviving persister bacteria. However, additional research is needed to confirm this hypothesis.
The main limitations of our study are the limited assortment of tested bacterial strains, which means that the data cannot be extrapolated to other species, and the static nature of the in vitro model, which overlooks the dynamics of the intraarticular environment, in which the TXA concentration is expected to be influenced by the rate of formation and final volume of periarticular hematoma, followed by resorption into the extra-/intracellular space of periarticular tissues and blood circulation [38,39]. In other words, concentrations of TXA above 50 mg/mL after standard intraarticular application are unlikely to persist for more than a few hours, given the biological half-life of TXA in the synovial fluid of 2–3 h [38]. This is relevant, since the bacteriostatic effect was observed in susceptible strains only when exposed to the highest tested concentrations in a controlled environment. In order to elucidate further the dynamics of local TXA concentrations after topical application in vivo, additional clinical studies are essential.
5. Conclusions
To date, this is the first in vitro study to evaluate the effect of increasing concentrations of TXA on the growth and viability of multiple strains of Staphylococci spp., Escherichia spp., Enterococcus spp., and Pseudomonas spp. The results of our study show that TXA in clinically relevant concentrations does affect the growth dynamics of the tested pathogenic bacteria. Although none of the tested concentrations of TXA proved bactericidal in the 24-h incubation period, significant susceptibility of target bacteria to TXA became evident at different growth stages. The perceived reduction of early postoperative infections when using perioperative TXA could therefore be in some measure associated with its growth-altering properties.
Supplementary Materials
The following supporting information can be downloaded at: https://www.mdpi.com/article/10.3390/app13169050/s1, Figure S1: Growth curves of S. aureus ATCC 25923 exposed to different (0.78–100 mg/mL) TXA concentrations for 24 h; Figure S2: Growth curves of S. aureus ATCC 29213 exposed to different (0.78–100 mg/mL) TXA concentrations for 24 h; Figure S3: Growth curves of S. aureus ATCC 700698 exposed to different (0.78–100 mg/mL) TXA concentrations for 24 h; Figure S4: Growth curves of S. aureus ATCC 700699 exposed to different (0.78–100 mg/mL) TXA concentrations for 24 h; Figure S5: Growth curves of S. aureus OBV 17/104 exposed to different (0.78–100 mg/mL) TXA concentrations for 24 h; Figure S6. Growth curves of S. aureus ATCC 43300 exposed to different (0.78–100 mg/mL) TXA concentrations for 24 h; Figure S7: Growth curves of S. epidermidis DSM 28319 exposed to different (0.78–100 mg/mL) TXA concentrations for 24 h; Figure S8: Growth curves of S. epidermidis DSM 3269 exposed to different (0.78–100 mg/mL) TXA concentrations for 24 h; Figure S9: Growth curves of S. epidermidis ATCC 12228 exposed to different (0.78–100 mg/mL) TXA concentrations for 24 h; Figure S10: Growth curves of S. epidermidis OBV 14/175-2 exposed to different (0.78–100 mg/mL) TXA concentrations for 24 h; Figure S11: Growth curves of S. epidermidis OBV 14/175-3 exposed to different (0.78–100 mg/mL) TXA concentrations for 24 h; Figure S12: Growth curves of S. epidermidis OBV 12/122 exposed to different (0.78–100 mg/mL) TXA concentrations for 24 h; Figure S13: Growth curves of S. lugdunensis OBV 20/143 exposed to different (0.78–100 mg/mL) TXA concentrations for 24 h; Figure S14: Growth curves of P. aeruginosa DSM 21385 exposed to different (0.78–100 mg/mL) TXA concentrations for 24 h; Figure S15: Growth curves of P. aeruginosa OBV 19/662 exposed to different (0.78–100 mg/mL) TXA concentrations for 24 h; Figure S16: Growth curves of E. faecalis ATCC 29212 exposed to different (0.78–100 mg/mL) TXA concentrations for 24 h; Figure S17: Growth curves of E. faecalis OBV 11/850 exposed to different (0.78–100 mg/mL) TXA concentrations for 24 h; Figure S18: Growth curves of E. faecium ATCC 11/549-b exposed to different (0.78–100 mg/mL) TXA concentrations for 24 h; Figure S19: Growth curves of E. coli ATCC 25922 exposed to different (0.78–100 mg/mL) TXA concentrations for 24 h; Figure S20: Growth curves of E. coli DSM 613 exposed to different (0.78–100 mg/mL) TXA concentrations for 24 h; Figure S21: Growth curves of E. coli OBV 14/112 exposed to different (0.78–100 mg/mL) TXA concentrations for 24 h; Figure S22: Growth curves of E. coli OBV 12/344 exposed to different (0.78–100 mg/mL) TXA concentrations for 24 h; Table S1: The maximum specific growth rate (µ) and lag time (λ) of bacterial strains at different TXA concentrations.
Author Contributions
Conceptualization, K.Š., U.S., S.K. and A.C.; methodology, K.Š.; software, K.Š.; validation, K.Š. and U.S.; formal analysis, K.Š.; investigation, K.Š. and U.S.; resources, S.K.; data curation, K.Š.; writing—original draft preparation, K.Š. and U.S.; writing—review and editing, S.K. and A.C.; visualization, K.Š.; supervision, S.K. and A.C.; project administration, S.K.; funding acquisition, S.K. All authors have read and agreed to the published version of the manuscript.
Funding
This research and the APC were funded by the Slovenian Research Agency, grant number J3-3067.
Institutional Review Board Statement
The study was conducted in accordance with the Declaration of Helsinki and approved by The Medical Ethics Committee of the Republic of Slovenia (0120-54/2021/5, 16 February 2021).
Informed Consent Statement
Not applicable.
Data Availability Statement
The data presented in this study are available in Supplementary Materials.
Conflicts of Interest
The authors declare no conflict of interest. The funders had no role in the design of the study; in the collection, analyses, or interpretation of data; in the writing of the manuscript; or in the decision to publish the results.
References
- Akonjom, M.; Battenberg, A.; Beverland, D.; Choi, J.-H.; Fillingham, Y.; Gallagher, N.; Han, S.B.; Jang, W.Y.; Jiranek, W.; Manrique, J.; et al. General Assembly, Prevention, Blood Conservation: Proceedings of International Consensus on Orthopedic Infections. J. Arthroplast. 2019, 34, S147–S155. [Google Scholar] [CrossRef]
- Viola, J.; Gomez, M.M.; Restrepo, C.; Maltenfort, M.G.; Parvizi, J. Preoperative Anemia Increases Postoperative Complications and Mortality Following Total Joint Arthroplasty. J. Arthroplast. 2015, 30, 846–848. [Google Scholar] [CrossRef]
- Lu, M.; Sing, D.C.; Kuo, A.C.; Hansen, E.N. Preoperative Anemia Independently Predicts 30-Day Complications after Aseptic and Septic Revision Total Joint Arthroplasty. J. Arthroplast. 2017, 32, S197–S201. [Google Scholar] [CrossRef] [PubMed]
- Maempel, J.F.; Wickramasinghe, N.R.; Clement, N.D.; Brenkel, I.J.; Walmsley, P.J. The Pre-Operative Levels of Haemoglobin in the Blood Can Be Used to Predict the Risk of Allogenic Blood Transfusion after Total Knee Arthroplasty. Bone Jt. J. 2016, 98-B, 490–497. [Google Scholar] [CrossRef] [PubMed]
- Ekiz, C.; Agaoglu, L.; Karakas, Z.; Gurel, N.; Yalcin, I. The Effect of Iron Deficiency Anemia on the Function of the Immune System. Hematol. J. 2005, 5, 579–583. [Google Scholar] [CrossRef] [PubMed]
- Friedman, R.; Homering, M.; Holberg, G.; Berkowitz, S. Allogeneic Blood Transfusions and Postoperative Infections after Total Hip or Knee Arthroplasty. J. Bone Jt. Surg. Am. Vol. 2014, 96, 272–278. [Google Scholar] [CrossRef]
- Zhu, Y.; Zhang, F.; Chen, W.; Liu, S.; Zhang, Q.; Zhang, Y. Risk Factors for Periprosthetic Joint Infection after Total Joint Arthroplasty: A Systematic Review and Meta-Analysis. J. Hosp. Infect. 2015, 89, 82–89. [Google Scholar] [CrossRef]
- Barrachina, B.; Lopez-Picado, A.; Remon, M.; Fondarella, A.; Iriarte, I.; Bastida, R.; Rodríguez-Gascón, A.; Achaerandio, M.A.; Iturricastillo, M.C.; Aizpuru, F.; et al. Tranexamic Acid Compared with Placebo for Reducing Total Blood Loss in Hip Replacement Surgery: A Randomized Clinical Trial. Anesth. Analg. 2016, 122, 986–995. [Google Scholar] [CrossRef]
- Yang, Z.-G.; Chen, W.-P.; Wu, L.-D. Effectiveness and Safety of Tranexamic Acid in Reducing Blood Loss in Total Knee Arthroplasty: A Meta-Analysis. J. Bone Jt. Surg. Am. Vol. 2012, 94, 1153–1159. [Google Scholar] [CrossRef]
- Fillingham, Y.A.; Ramkumar, D.B.; Jevsevar, D.S.; Yates, A.J.; Shores, P.; Mullen, K.; Bini, S.A.; Clarke, H.D.; Schemitsch, E.; Johnson, R.L.; et al. The Efficacy of Tranexamic Acid in Total Hip Arthroplasty: A Network Meta-Analysis. J. Arthroplast. 2018, 33, 3083–3089.e4. [Google Scholar] [CrossRef]
- Fillingham, Y.A.; Ramkumar, D.B.; Jevsevar, D.S.; Yates, A.J.; Shores, P.; Mullen, K.; Bini, S.A.; Clarke, H.D.; Schemitsch, E.; Johnson, R.L.; et al. The Efficacy of Tranexamic Acid in Total Knee Arthroplasty: A Network Meta-Analysis. J. Arthroplast. 2018, 33, 3090–3098.e1. [Google Scholar] [CrossRef] [PubMed]
- Gandhi, R.; Evans, H.M.K.; Mahomed, S.R.; Mahomed, N.N. Tranexamic Acid and the Reduction of Blood Loss in Total Knee and Hip Arthroplasty: A Meta-Analysis. BMC Res. Notes 2013, 6, 184. [Google Scholar] [CrossRef] [PubMed] [Green Version]
- Sukeik, M.; Alshryda, S.; Haddad, F.S.; Mason, J.M. Systematic Review and Meta-Analysis of the Use of Tranexamic Acid in Total Hip Replacement. J. Bone Jt. Surg. Br. Vol. 2011, 93, 39–46. [Google Scholar] [CrossRef] [PubMed] [Green Version]
- Sukeik, M.; Alshryda, S.; Powell, J.; Haddad, F.S. The Effect of Tranexamic Acid on Wound Complications in Primary Total Hip Arthroplasty: A Meta-Analysis. Surgeon 2020, 18, 53–61. [Google Scholar] [CrossRef] [PubMed]
- Yazdi, H.; Klement, M.R.; Hammad, M.; Inoue, D.; Xu, C.; Goswami, K.; Parvizi, J. Tranexamic Acid Is Associated with Reduced Periprosthetic Joint Infection after Primary Total Joint Arthroplasty. J. Arthroplast. 2020, 35, 840–844. [Google Scholar] [CrossRef] [Green Version]
- Björlin, G.; Nilsson, I.M. The Effect of Antifibrinolytic Agents on Wound Healing. Int. J. Oral Maxillofac. Surg. 1988, 17, 275–276. [Google Scholar] [CrossRef]
- Gupta, A.; Singh, M.; Raina, P.; Singh, S.; Ahmad, S.; Imran, S.; Sharma, R.; Malhotra, S. Post-Surgical Wound Care in Orthopedics: Role of Tranexamic Acid. J. Evol. Med. Dent. Sci. 2015, 4, 5716–5720. [Google Scholar] [CrossRef]
- Yuan, C.; Wang, X.-M.; Yang, L.-J.; Wu, P.-L. Tranexamic Acid Accelerates Skin Barrier Recovery and Upregulates Occludin in Damaged Skin. Int. J. Derm. 2014, 53, 959–965. [Google Scholar] [CrossRef]
- Sugimoto, M.A.; Ribeiro, A.L.C.; Costa, B.R.C.; Vago, J.P.; Lima, K.M.; Carneiro, F.S.; Ortiz, M.M.O.; Lima, G.L.N.; Carmo, A.A.F.; Rocha, R.M.; et al. Plasmin and Plasminogen Induce Macrophage Reprogramming and Regulate Key Steps of Inflammation Resolution via Annexin A1. Blood 2017, 129, 2896–2907. [Google Scholar] [CrossRef] [Green Version]
- Borg, R.J.; Samson, A.L.; Au, A.E.-L.; Scholzen, A.; Fuchsberger, M.; Kong, Y.Y.; Freeman, R.; Mifsud, N.A.; Plebanski, M.; Medcalf, R.L. Dendritic Cell-Mediated Phagocytosis but Not Immune Activation Is Enhanced by Plasmin. PLoS ONE 2015, 10, e0131216. [Google Scholar] [CrossRef] [Green Version]
- Ausen, K.; Pleym, H.; Liu, J.; Hegstad, S.; Nordgård, H.B.; Pavlovic, I.; Spigset, O. Serum Concentrations and Pharmacokinetics of Tranexamic Acid after Two Means of Topical Administration in Massive Weight Loss Skin-Reducing Surgery. Plast. Reconstr. Surg. 2019, 143, 1169–1178. [Google Scholar] [CrossRef]
- Kim, Y.T.; Kang, M.W.; Lee, J.K.; Lee, Y.M.; Kim, J.I. Combined Use of Topical Intraarticular Tranexamic Acid and Rivaroxaban in Total Knee Arthroplasty Safely Reduces Blood Loss, Transfusion Rates, and Wound Complications without Increasing the Risk of Thrombosis. BMC Musculoskelet. Disord. 2018, 19, 227. [Google Scholar] [CrossRef] [PubMed] [Green Version]
- Sitek, P.; Wysocka-Wycisk, A.; Kępski, F.; Król, D.; Bursig, H.; Dyląg, S. PRP-Fibrinogen Gel-like Chondrocyte Carrier Stabilized by TXA-Preliminary Study. Cell Tissue Bank 2013, 14, 133–140. [Google Scholar] [CrossRef] [PubMed]
- McLean, M.; McCall, K.; Smith, I.D.M.; Blyth, M.; Kitson, S.M.; Crowe, L.A.N.; Leach, W.J.; Rooney, B.P.; Spencer, S.J.; Mullen, M.; et al. Tranexamic Acid Toxicity in Human Periarticular Tissues. Bone Jt. Res. 2019, 8, 11–18. [Google Scholar] [CrossRef]
- Eikebrokk, T.A.; Vassmyr, B.S.; Ausen, K.; Gravastrand, C.; Spigset, O.; Pukstad, B. Cytotoxicity and Effect on Wound Re-epithelialization after Topical Administration of Tranexamic Acid. BJS Open 2019, 3, 840–851. [Google Scholar] [CrossRef] [PubMed]
- Furst, W.; Banerjee, A.; Redl, H. Comparison of Structure, Strength and Cytocompatibility of a Fibrin Matrix Supplemented Either with Tranexamic Acid or Aprotinin. J. Biomed. Mater. Res. B Appl. Biomater. 2007, 82, 109–114. [Google Scholar] [CrossRef]
- Benjumea, A.; Díaz-Navarro, M.; Hafian, R.; Sánchez-Somolinos, M.; Vaquero, J.; Chana, F.; Muñoz, P.; Guembe, M. Effect of Tranexamic Acid against Staphylococcus Spp. and Cutibacterium Acnes Associated with Peri-Implant Infection: Results from an In Vitro Study. Microbiol. Spectr. 2022, 10, e01612-21. [Google Scholar] [CrossRef]
- Benjumea, A.; Díaz-Navarro, M.; Hafian, R.; Cercenado, E.; Sánchez-Somolinos, M.; Vaquero, J.; Chana, F.; Muñoz, P.; Guembe, M. Tranexamic Acid in Combination with Vancomycin or Gentamicin Has a Synergistic Effect against Staphylococci. Front. Microbiol. 2022, 13, 935646. [Google Scholar] [CrossRef]
- Wang, J.; Zhang, Z.; Li, J.; Huang, B.; Jiang, Z.; Pan, Y.; He, T.; Hu, Y.; Wang, L. Tranexamic Acid Protects against Implant-Associated Infection by Reducing Biofilm Formation. Sci. Rep. 2022, 12, 4840. [Google Scholar] [CrossRef]
- Wiegand, I.; Hilpert, K.; Hancock, R.E.W. Agar and Broth Dilution Methods to Determine the Minimal Inhibitory Concentration (MIC) of Antimicrobial Substances. Nat. Protoc. 2008, 3, 163–175. [Google Scholar] [CrossRef]
- Brewster, J.D. A Simple Micro-Growth Assay for Enumerating Bacteria. J. Microbiol. Methods 2003, 53, 77–86. [Google Scholar] [CrossRef]
- Zwietering, M.H.; Jongenburger, I.; Rombouts, F.M.; van’t Riet, K. Modeling of the Bacterial Growth Curve. Appl. Environ. Microbiol. 1990, 56, 1875–1881. [Google Scholar] [CrossRef]
- Frisch, N.B.; Wessell, N.M.; Charters, M.A.; Yu, S.; Jeffries, J.J.; Silverton, C.D. Predictors and Complications of Blood Transfusion in Total Hip and Knee Arthroplasty. J. Arthroplast. 2014, 29, 189–192. [Google Scholar] [CrossRef] [PubMed]
- Everhart, J.S.; Sojka, J.H.; Mayerson, J.L.; Glassman, A.H.; Scharschmidt, T.J. Perioperative Allogeneic Red Blood-Cell Transfusion Associated with Surgical Site Infection after Total Hip and Knee Arthroplasty. J. Bone Jt. Surg. Am. Vol. 2018, 100, 288–294. [Google Scholar] [CrossRef] [PubMed]
- Benito, N.; Mur, I.; Ribera, A.; Soriano, A.; Rodríguez-Pardo, D.; Sorlí, L.; Cobo, J.; Fernández-Sampedro, M.; del Toro, M.D.; Guío, L.; et al. The Different Microbial Etiology of Prosthetic Joint Infections According to Route of Acquisition and Time after Prosthesis Implantation, Including the Role of Multidrug-Resistant Organisms. J. Clin. Med. 2019, 8, 673. [Google Scholar] [CrossRef] [Green Version]
- Clinical and Laboratory Standards Institute [CLSI] Methods for Dilution Antimicrobial Susceptibility Tests for Bacteria That Grow Aerobically. 2018. Available online: https://clsi.org/standards/products/microbiology/documents/m07 (accessed on 19 February 2023).
- Theophel, K.; Schacht, V.J.; Schlüter, M.; Schnell, S.; Stingu, C.-S.; Schaumann, R.; Bunge, M. The Importance of Growth Kinetic Analysis in Determining Bacterial Susceptibility against Antibiotics and Silver Nanoparticles. Front. Microbiol. 2014, 5, 544. [Google Scholar] [CrossRef]
- Ahlberg, A.; Eriksson, O.; Kjellman, H. Diffusion of Tranexamic Acid to the Joint. Acta Orthop. Scand. 1976, 47, 486–488. [Google Scholar] [CrossRef] [PubMed]
- Nilsson, I.M. Clinical Pharmacology of Aminocaproic and Tranexamic Acids. J. Clin. Pathol. Suppl. (R. Coll. Pathol.) 1980, 14, 41–47. [Google Scholar] [CrossRef] [Green Version]
Figure 1.
Effects of different TXA concentrations on the proliferation of 22 clinically relevant bacterial strains after 24 h incubation.
Figure 1.
Effects of different TXA concentrations on the proliferation of 22 clinically relevant bacterial strains after 24 h incubation.

Figure 2.
Representative examples of growth curves for bacteria exposed to different (12.5–100 mg/mL) TXA concentrations for 24 h: (a) E. faecalis OBV 11/850; (b) S. aureus ATCC 43300. The curves represent OD600nm values as a function of time.
Figure 2.
Representative examples of growth curves for bacteria exposed to different (12.5–100 mg/mL) TXA concentrations for 24 h: (a) E. faecalis OBV 11/850; (b) S. aureus ATCC 43300. The curves represent OD600nm values as a function of time.

Figure 3.
Number of bacterial strains that showed a TXA-dependent decrease in population density after 24 h of incubation at different TXA concentrations compared with their respective reference control.
Figure 3.
Number of bacterial strains that showed a TXA-dependent decrease in population density after 24 h of incubation at different TXA concentrations compared with their respective reference control.

Figure 4.
Number of bacterial strains that showed a prolonged lag phase compared with their respective reference control.
Figure 4.
Number of bacterial strains that showed a prolonged lag phase compared with their respective reference control.

Figure 5.
Number of bacterial strains that showed a decrease in the maximum specific growth rate during incubation at different TXA concentrations compared with their respective reference controls.
Figure 5.
Number of bacterial strains that showed a decrease in the maximum specific growth rate during incubation at different TXA concentrations compared with their respective reference controls.


Table 1.
Bacterial strains and strain details.
| Bacteria | Strain | Strain Details |
|---|---|---|
| Staphylococcus aureus | ATCC 25923 | Clinical isolate |
| Staphylococcus aureus | ATCC 29213 | Clinical isolate; wound |
| Staphylococcus aureus (MRSA) | ATCC 43300 | Clinical isolate; resistant to methicillin and oxacillin |
| Staphylococcus aureus (MRSA) | ATCC 700698 | Clinical isolate; sputum from lung cancer patient with MRSA pneumonia; resistant to methicillin |
| Staphylococcus aureus (MRSA) | ATCC 700699 | Clinical isolate; from pus and debrided tissue at surgical incision in sternum of an infant; resistant to methicillin and oxacillin; reduced vancomycin susceptibility |
| Staphylococcus aureus (MRSA) | OBV 17/104 | Clinical isolate; PJI; resistant to methicillin |
| Staphylococcus epidermidis | DSM 28319 | Clinical isolate; catheter sepsis |
| Staphylococcus epidermidis | DSM 3269 | Clinical isolate; infected catheter tip; resistant to aztreonam |
| Staphylococcus epidermidis | ATCC 12228 | Non-infection associated strain |
| Staphylococcus epidermidis | OBV 14/175-2 | Clinical isolate; PJI |
| Staphylococcus epidermidis | OBV 14/175-3 | Clinical isolate; PJI; resistant to erythromycin, clindamycin, and oxacillin |
| Staphylococcus epidermidis | OBV 12/122 | Clinical isolate; PJI |
| Staphylococcus lugdunensis | OBV 20/143 | Clinical isolate; PJI |
| Pseudomonas aeruginosa | DSM 21385 | Human pathogen |
| Pseudomonas aeruginosa | OBV 19/662 | Clinical isolate; PJI; resistant to ciprofloxacin |
| Enterococcus faecalis | ATCC 29212 | Clinical isolate; uroinfection |
| Enterococcus faecalis | OBV 11/850 | Clinical isolate; PJI |
| Enterococcus faecium | OBV 11/549-b | Clinical isolate; PJI |
| Escherichia coli | ATCC 25922 | Clinical isolate |
| Escherichia coli | DSM 613 | B strain |
| Escherichia coli | OBV 14/112 | Clinical isolate; PJI; resistant to quinolones |
| Escherichia coli | OBV 12/344 | Clinical isolate; PJI |
Disclaimer/Publisher’s Note: The statements, opinions and data contained in all publications are solely those of the individual author(s) and contributor(s) and not of MDPI and/or the editor(s). MDPI and/or the editor(s) disclaim responsibility for any injury to people or property resulting from any ideas, methods, instructions or products referred to in the content. |
© 2023 by the authors. Licensee MDPI, Basel, Switzerland. This article is an open access article distributed under the terms and conditions of the Creative Commons Attribution (CC BY) license (https://creativecommons.org/licenses/by/4.0/).
Share and Cite
MDPI and ACS Style
Slokar, U.; Kovač, S.; Cör, A.; Šuster, K. Antibacterial Effect of Topically Administered Tranexamic Acid in Large Joint Arthroplasty. Appl. Sci. 2023, 13, 9050. https://doi.org/10.3390/app13169050
AMA Style
Slokar U, Kovač S, Cör A, Šuster K. Antibacterial Effect of Topically Administered Tranexamic Acid in Large Joint Arthroplasty. Applied Sciences. 2023; 13(16):9050. https://doi.org/10.3390/app13169050
Chicago/Turabian StyleSlokar, Urban, Simon Kovač, Andrej Cör, and Katja Šuster. 2023. "Antibacterial Effect of Topically Administered Tranexamic Acid in Large Joint Arthroplasty" Applied Sciences 13, no. 16: 9050. https://doi.org/10.3390/app13169050
Note that from the first issue of 2016, this journal uses article numbers instead of page numbers. See further details here.